Build a professional survey results report
Features for you: Cross-tabs Data exports Advanced filters
Or make it simple:
Grow your business with data-driven customer insight
Make the most of your data with a powerful, professional survey results report.
Real-time data
As soon as a respondent hits 'Submit', you can analyze data to make customer informed decisions.
Multiple reports
Create unlimited reports based on your data set, each with their own view of the data.
Analyze together
Invite your team members to collaborate on projects and dig into your survey data together.
Email Metrics
All your data in one place
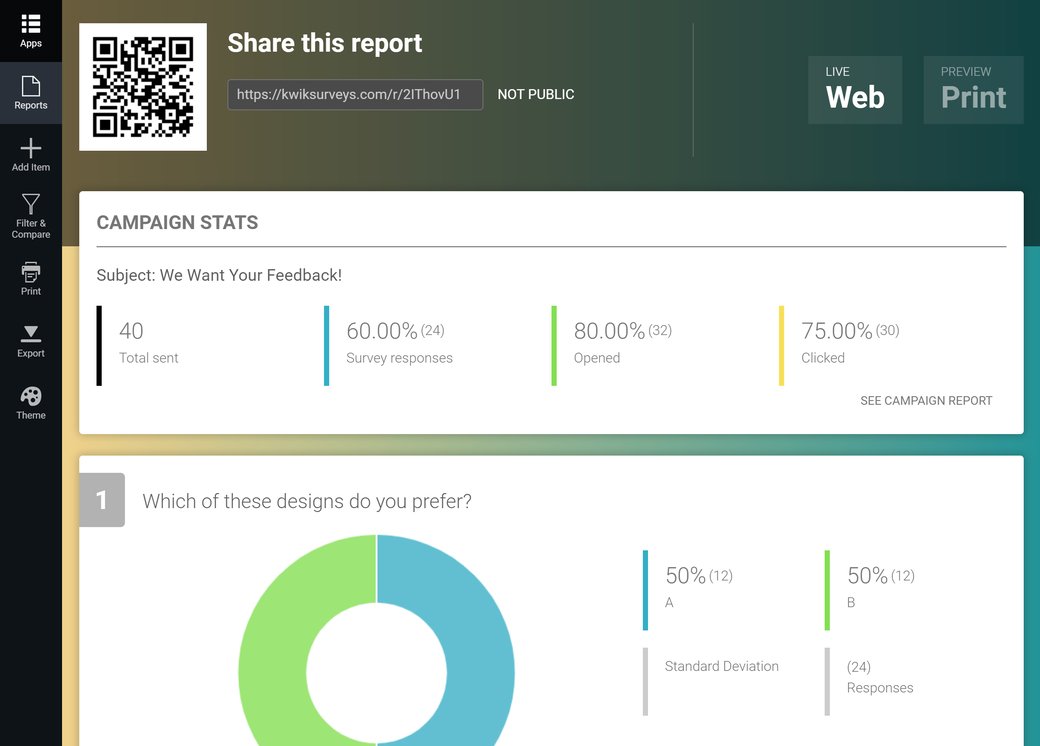
When sharing your survey via email invitations, all engagement metrics associated with that campaign will be available in your survey report.
Run multiple email invitation campaigns for the same survey, and access the full report for each from the same place.
Easily identify which CRM contacts opened emails, clicked links, and responded to your survey.


Cross-Tabulation & Filters
Identify patterns and trends with the click of a button
Filter your survey results report by question, date, CRM groups, email metrics, and more to learn as much as you can about your respondents.
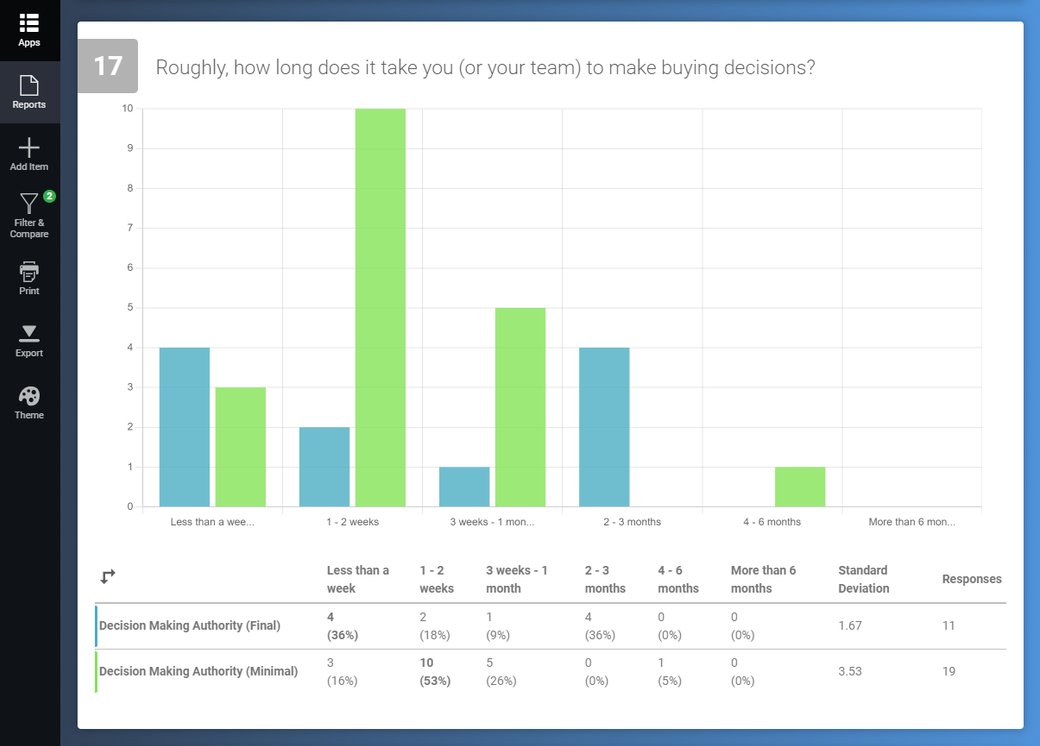
Go beyond the who and what to find out the why, with advanced cross-tabulation. Compare sets of data using two or more filters to get more detailed views of your results.
Sharing Your Survey Results Report
Easy access and export options for all
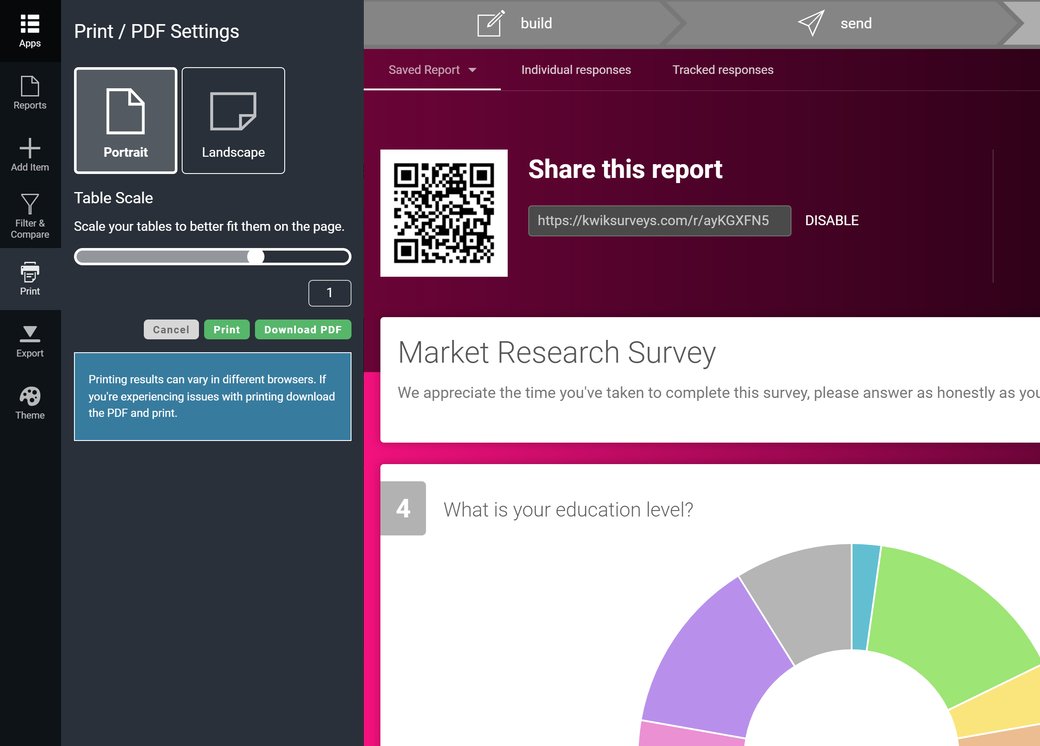
Export offline copies of your results as a PDF or XLSX spreadsheet. PDFs contain all the charts and graphs we generate for your report. Whereas spreadsheets provide tabs for compiled results and individual responses.
Make your digital report accessible with a URL link, which you can share with team members and other stakeholders who’re interested in your findings.

Trusted by over 3 million customers and businesses worldwide
Start growing your business with data-driven insights in three simple steps: Build > Send > Analyze.


